Data-spheres of Planetary Urbanization
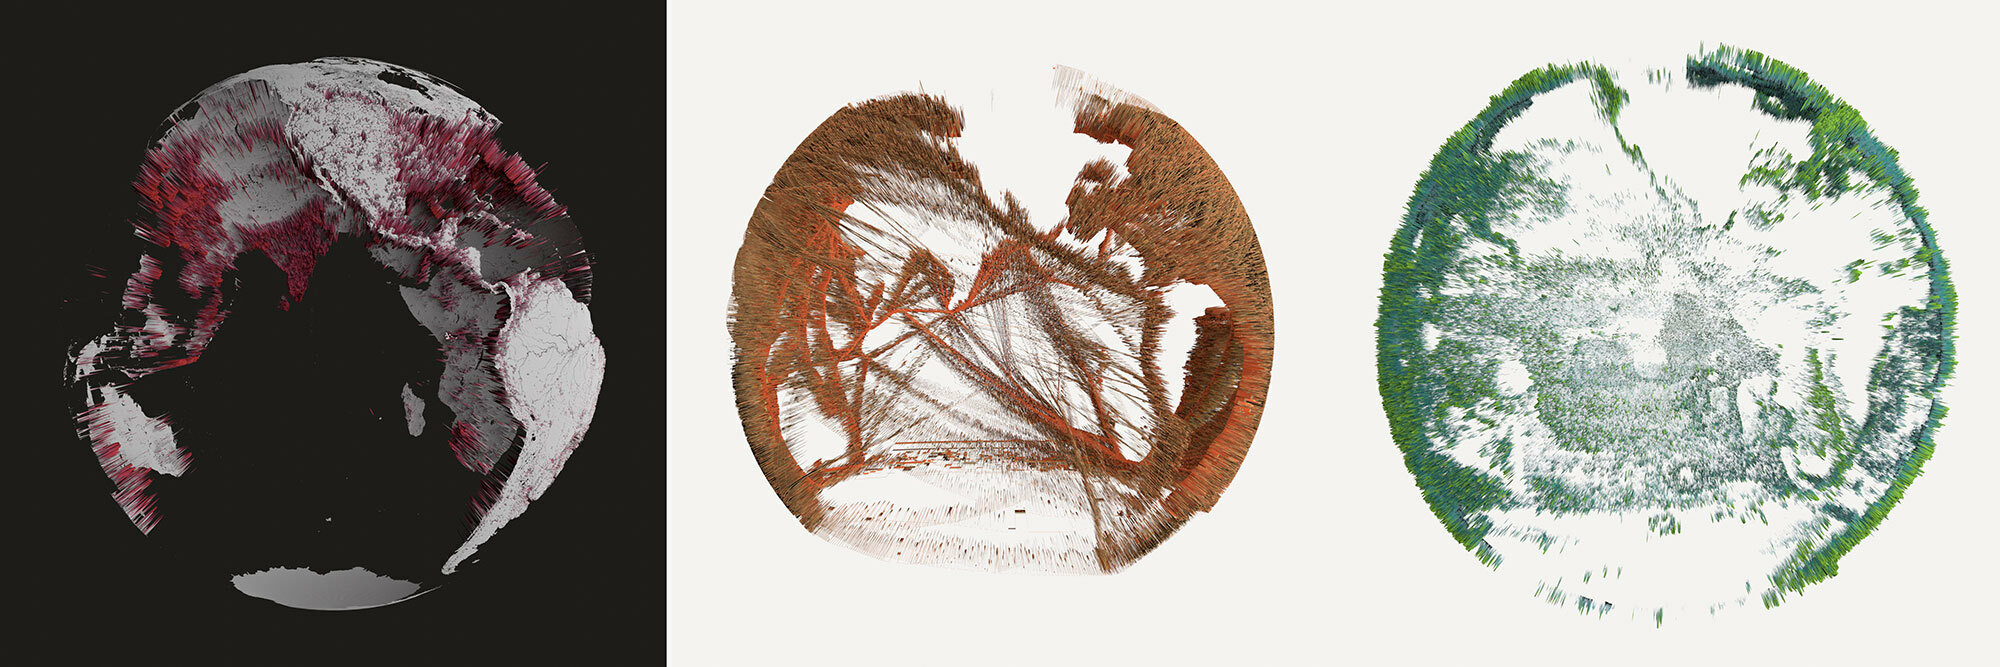
Data-spheres visualizing selected indicators of Planetary Urbanization processes: GDP reflecting concentration (left), shipping reflecting circulation (middle), fishing reflecting production (right)
How can we map the urbanization of the planet? This exhibition explores this question through a series of experimental visualizations of the worldwide urban fabric. 12 globes serve as “data-spheres” that depict the urban world on the basis of important indicators related to the spatial imprint of cities, the geographies of their supply zones and the logistics networks that connect cities to one another and to diverse regional hinterlands. Reversing the mainstream, city-centric metageography of urbanization, the data-spheres reveal the importance of operational landscapes beyond the city (zones of agriculture, extraction, forestry and fishing), as well as planetary logistical infrastructures, that directly support urban life.
From this point of view, the world of contemporary urbanization encompasses much of the planet, including apparently remote areas, wildlands and oceans. Cities are not only producers of value, but entropic black holes that consume surpluses produced elsewhere. Non-city spaces are, correspondingly, the metabolic bases of planetary urbanization.
These visual speculations are offered as an exploration of the analytical and imaginative work that can be done with geospatial data. By illustrating how radically divergent cartographies of an urbanized planet can be constructed on the basis of different indicators, the data-spheres interrupt the authoritative, scientific “aura” that often pervades geospatial information. Rather than offering a photographic, objective “capture” of ground-conditions, the data-spheres invite viewers to question their own cognitive maps of contemporary urbanization, and to imagine new urban worlds that might more fully embody our collective aspirations.